PART 8 — GEOPOLITICAL CONTEXT & BRICS+ DYNAMICS
WEALDRAED THRYMMELLEN
Email: info@wealdraedthrymmellen.org
Phone: +971 58 540 3888
Downloadable link: https://drive.google.com/uc?export=download&id=16huleqgxU2FkY8RIyn-J50JVIdUAXGvs
Report Period: January – April 2026
Published: May 2026
Sources: S&P Global Platts · Argus Media · LME · CBOT · Baltic Exchange · EIA · IEA · USDA · World Bank · LBMA · OPEC · FAO · ISCC · wealdraedthrymmellen.org
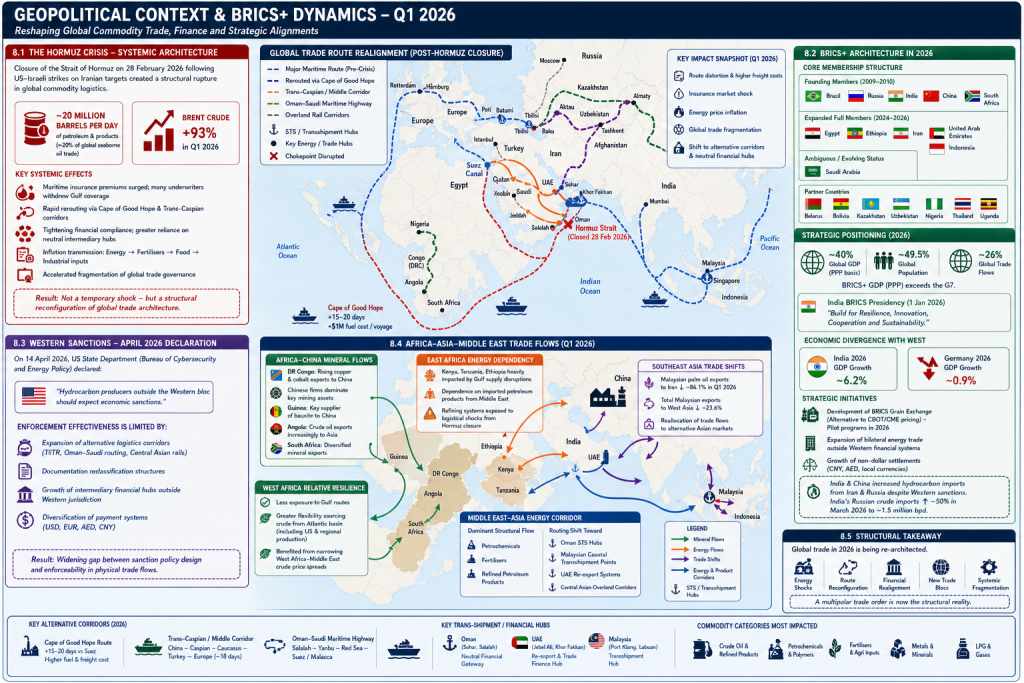
8.1 THE HORMUZ CRISIS — SYSTEMIC ARCHITECTURE
The closure of the Strait of Hormuz on 28 February 2026, following military escalation involving US–Israeli strikes on Iranian targets, represented a structural rupture in global commodity logistics rather than a localized geopolitical incident.
The Strait normally processes approximately 20 million barrels per day of petroleum and related products, representing roughly 20% of global seaborne oil trade. Its disruption therefore propagated immediately across all interconnected energy and commodity systems.
Key systemic effects included:
- Brent crude prices rising by approximately +93% in Q1 2026
- Maritime insurance markets experiencing acute premium inflation, with many underwriters temporarily withdrawing Gulf coverage
- Rapid reconfiguration of global trade routes toward Cape of Good Hope and Trans-Caspian corridors
- Tightening of international financial compliance and increased reliance on neutral intermediary hubs
- Broad-based inflation transmission from energy → fertilisers → food → industrial inputs
- Accelerated fragmentation of global trade governance systems
The result was not a temporary shock but a structural reconfiguration of global trade architecture.
8.2 BRICS+ ARCHITECTURE IN 2026
The BRICS+ framework has evolved into a multi-layered economic bloc with expanding membership and increasing institutional depth.
CORE MEMBERSHIP STRUCTURE
Founding members (2009–2010):
- Brazil
- Russia
- India
- China
- South Africa
Expanded full members (2024–2026):
- Egypt
- Ethiopia
- Iran
- United Arab Emirates
- Indonesia
Ambiguous or evolving status:
- Saudi Arabia
Partner countries:
- Belarus
- Bolivia
- Kazakhstan
- Uzbekistan
- Nigeria
- Thailand
- Uganda
STRATEGIC POSITIONING
BRICS+ in 2026 represents a significant share of global economic activity:
- Approximately 40% of global GDP (PPP basis)
- Around 49.5% of global population
- Approximately 26% of global trade flows
In comparative macroeconomic terms, BRICS+ exceeds the G7 in GDP share under PPP valuation frameworks.
India assumed the BRICS presidency on 1 January 2026, operating under the theme:
“Build for Resilience, Innovation, Cooperation and Sustainability.”
ECONOMIC DIVERGENCE WITH WESTERN ECONOMIES
A key structural divergence is evident in growth trajectories:
- India 2026 GDP growth: ~6.2%
- Germany 2026 GDP growth: ~0.9%
This divergence reinforces the long-term shift of economic gravity toward Asia and emerging markets.
STRATEGIC INITIATIVES
BRICS+ has advanced several structural initiatives:
- Development of a BRICS grain exchange as an alternative to CBOT/CME pricing systems
- Pilot programmes scheduled during 2026
- Continued expansion of bilateral energy trade outside Western financial systems
- Strengthening of non-dollar settlement mechanisms, including CNY and AED usage in energy trade
India and China have maintained or increased hydrocarbon imports from Iran and Russia despite Western sanctions frameworks.
India’s Russian crude imports alone increased by approximately 50% in March 2026, reaching around 1.5 million barrels per day.
8.3 WESTERN SANCTIONS — APRIL 2026 DECLARATION
On 14 April 2026, the US State Department (Bureau of Cybersecurity and Energy Policy) issued a strategic statement indicating that:
“Hydrocarbon producers outside the Western bloc should expect economic sanctions.”
This reflects an escalation in regulatory fragmentation across global energy markets.
However, enforcement effectiveness is increasingly limited due to:
- Expansion of alternative logistics corridors (TITR, Oman–Saudi routing, Central Asian rail networks)
- Increased use of documentation reclassification structures
- Growth of intermediary financial hubs outside Western jurisdiction
- Diversification of payment systems across USD, EUR, AED, and CNY
The result is a widening gap between sanction policy design and enforceability in physical trade flows.
8.4 AFRICA–ASIA–MIDDLE EAST TRADE FLOWS
Global commodity flows in Q1 2026 show increasing interdependence between African producers, Asian consumers, and Middle Eastern logistics hubs.
AFRICA–CHINA MINERAL FLOWS
- Democratic Republic of Congo: rising copper and cobalt exports to China
- Chinese firms maintain dominant positions in extraction assets, including major mining complexes
- Guinea: key supplier of bauxite to Chinese industrial supply chains
- Angola: crude oil exports increasingly directed toward Asian markets
- South Africa: diversified mineral exports supporting industrial and energy supply chains
EAST AFRICA ENERGY DEPENDENCY
- Kenya, Tanzania, and Ethiopia heavily impacted by Gulf supply disruptions
- Structural dependence on imported petroleum products from Middle Eastern suppliers
- Refining systems exposed to logistical shocks from Hormuz closure
WEST AFRICA RELATIVE RESILIENCE
- Less exposure to Gulf supply routes
- Greater flexibility in sourcing crude from Atlantic basin (including US and regional production)
- Benefited from narrowing West Africa–Middle East crude price spreads
SOUTHEAST ASIA TRADE SHIFTS
- Malaysian palm oil exports to Iran declined sharply (–86.1% in Q1 2026)
- Total Malaysian exports to West Asia fell by approximately 23.6%
- Reallocation of trade flows toward alternative Asian markets
MIDDLE EAST–ASIA ENERGY CORRIDOR
The dominant structural flow remains:
- Petrochemicals
- Fertilisers
- Refined petroleum products
However, routing has shifted significantly toward:
- Oman STS hubs
- Malaysian coastal transshipment points
- UAE re-export systems
- Central Asian overland corridors
These adaptations reflect a structural reorganisation rather than temporary rerouting.
WEALDRAED THRYMMELLEN
Email: info@wealdraedthrymmellen.org
Phone: +971 58 540 3888
Downloadable link: https://drive.google.com/uc?export=download&id=16huleqgxU2FkY8RIyn-J50JVIdUAXGvs
Report Period: January – April 2026
Published: May 2026
Sources: S&P Global Platts · Argus Media · LME · CBOT · Baltic Exchange · EIA · IEA · USDA · World Bank · LBMA · OPEC · FAO · ISCC · wealdraedthrymmellen.org