PART 5 — FREIGHT, LOGISTICS & NEW CORRIDORS: Q1 2026 GLOBAL COMMODITY MARKETS
WEALDRAED THRYMMELLEN
Email: info@wealdraedthrymmellen.org
Phone: +971 58 540 3888
Downloadable link: https://drive.google.com/uc?export=download&id=16huleqgxU2FkY8RIyn-J50JVIdUAXGvs
Report Period: January – April 2026
Published: May 2026
Sources: S&P Global Platts · Argus Media · LME · CBOT · Baltic Exchange · EIA · IEA · USDA · World Bank · LBMA · OPEC · FAO · ISCC · wealdraedthrymmellen.org
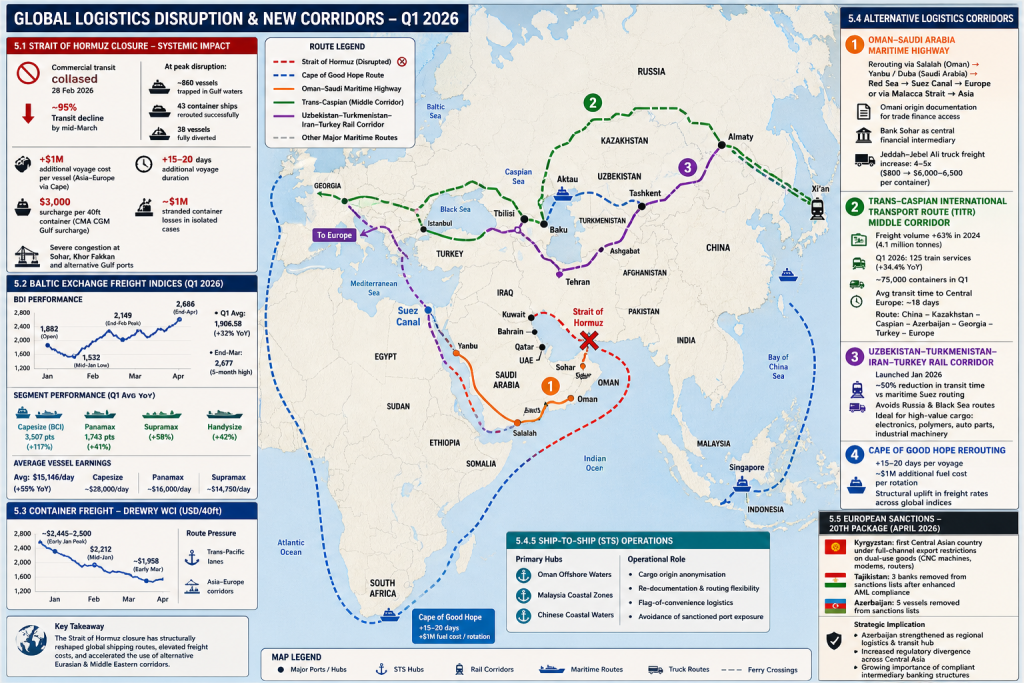
5.1 STRAIT OF HORMUZ CLOSURE — SYSTEMIC IMPACT
On 28 February 2026, commercial transit through the Strait of Hormuz collapsed following escalation in regional hostilities. By mid-March, transit had fallen by approximately 95%, effectively reaching zero for most commercial flows.
At peak disruption:
- Around 860 vessels were trapped within Gulf waters
- 43 container ships initially bound for Gulf destinations were successfully rerouted
- 38 vessels were fully diverted to alternative routes
The Strait of Hormuz normally handles roughly 13 million barrels per day of crude oil and condensates, alongside significant volumes of refined petroleum products and LNG.
The consequences were immediate and structural:
- Additional voyage costs of approximately $1 million per vessel on Asia–Europe routes via the Cape of Good Hope
- Extended voyage duration of up to 20 days per rotation
- Container surcharges reaching $3,000 per 40ft container (CMA CGM Gulf surcharge)
- Exceptional cargo cost anomalies, with stranded container losses reported near $1 million per unit in isolated cases
- Severe congestion at alternative Gulf ports including Sohar and Khor Fakkan
This event fundamentally redefined global maritime routing assumptions in Q1 2026.
5.2 BALTIC EXCHANGE FREIGHT INDICES
The Baltic Exchange indices reflected extreme volatility and sustained upward pressure across all vessel classes.
Key Q1 2026 performance:
- Baltic Dry Index (BDI) opened at 1,882 points
- Mid-January low recorded at 1,532 points
- End-February peak reached 2,149 points
- Q1 average approximately 1,906.58 points (+32% year-on-year)
- End-March level around 2,677 points (five-month high)
- End-April stabilisation at 2,686 points
Segment performance:
- Capesize (BCI) peaked at 3,507 points (+117% YoY)
- Panamax averaged 1,743 points (+41% YoY)
- Supramax rose approximately +58% YoY
- Handysize increased around +42% YoY
- Average vessel earnings reached approximately $15,146 per day (+55% YoY)
Earnings benchmarks:
- Capesize vessels: approximately $28,000 per day in February
- Panamax vessels: around $16,000 per day
- Supramax vessels: approximately $14,750 per day
The freight market reflected both energy-driven cost inflation and route distortion effects from Gulf disruption.
5.3 CONTAINER FREIGHT — DREWRY WORLD CONTAINER INDEX
Container shipping rates exhibited sharp volatility followed by partial stabilisation.
Key movements:
- Early January peak: approximately $2,445–2,500 per 40ft container (+16% MoM)
- Mid-January level: $2,212 per container (–10% YoY, –36% from prior highs)
- Early March stabilisation: approximately $1,958 per container
Route-specific pressure was concentrated on:
- Trans-Pacific trade lanes
- Asia–Europe corridors
Carriers increasingly adopted rerouting via the Cape of Good Hope for shipments previously dependent on Gulf transit.
5.4 ALTERNATIVE LOGISTICS CORRIDORS
The disruption of traditional maritime routes accelerated the expansion and utilisation of alternative corridors across Eurasia and the Middle East.
5.4.1 OMAN–SAUDI ARABIA MARITIME HIGHWAY
A new structured logistics corridor emerged in early March 2026.
Key features:
- Cargoes rerouted via Salalah (Oman)
- Transit through Saudi ports including Yanbu and Duba
- Redistribution via the Red Sea and Suez Canal toward Europe
- Alternative eastbound routing through the Malacca Strait toward Asia
Financial and documentation structure:
- Omani origin documentation used to facilitate trade finance access
- Bank Sohar positioned as a central financial intermediary
- Enables standard LC and insurance access otherwise restricted in direct Gulf-origin trade
Cost impacts:
- Truck freight between Jeddah and Jebel Ali increased by 4–5x
- Rates rose from approximately $800 to $6,000–6,500 per container
5.4.2 TRANS-CASPIAN INTERNATIONAL TRANSPORT ROUTE (TITR / MIDDLE CORRIDOR)
The Trans-Caspian International Transport Route (TITR) gained significant traction as a Eurasian alternative bypassing both Russia and the Strait of Hormuz.
Key developments:
- Freight volume growth of 63% in 2024, reaching 4.1 million tonnes
- Q1 2026 recorded 125 container train services (+34.4% YoY)
- Approximately 75,000 containers handled in Q1
- Average transit time to Central Europe: ~18 days
Structural advantages:
- Direct China–Kazakhstan–Caspian–Azerbaijan–Georgia–Turkey–Europe linkage
- Competitive transit times versus maritime Cape routing
- Full avoidance of Russian transit corridors and Gulf maritime exposure
Key constraints:
- Port congestion at Poti and Batumi
- Fragmented governance across multiple jurisdictions
- Exposure to South Caucasus geopolitical and climate risk
EU and Global Gateway funding continues to support digitalisation, customs integration, and interoperability.
5.4.3 UZBEKISTAN–TURKMENISTAN–IRAN–TURKEY RAIL CORRIDOR
Launched in January 2026, this corridor introduced a high-speed rail-based alternative for Eurasian cargo flows.
Key characteristics:
- Container rail services linking Central Asia to Turkey
- Approximately 50% reduction in transit time versus maritime Suez routing
- Full avoidance of Russian and Black Sea routes
- Strong suitability for high-value cargo (electronics, polymers, automotive components, industrial machinery)
This corridor strengthens Central Asia’s role as a land bridge between Asian production hubs and European consumption markets.
5.4.4 CAPE OF GOOD HOPE REROUTING
The Cape of Good Hope became a default fallback routing for Asia–Europe trade flows impacted by Gulf instability.
Key effects:
- Additional 15–20 days per voyage
- Fuel cost increases of approximately $1 million per rotation
- Partial absorption of global vessel capacity
- Structural uplift in freight rates across major shipping indices
This route effectively reset global maritime baseline costs for long-haul container and bulk shipping.
5.4.5 SHIP-TO-SHIP (STS) OPERATIONS
Ship-to-ship transfer systems expanded significantly across multiple regions.
Primary hubs:
- Oman offshore waters
- Malaysia coastal zones
- Chinese coastal waters
Operational role:
- Cargo origin anonymisation (notably Iranian crude and petrochemicals documented as Omani origin)
- Flexibility in cargo re-documentation and routing
- Facilitation of flag-of-convenience logistics structures
- Avoidance of direct sanctioned port exposure
STS operations became a core structural mechanism in maintaining continuity of hydrocarbon and petrochemical flows.
5.5 EUROPEAN SANCTIONS — 20TH PACKAGE (APRIL 2026)
The 20th sanctions package introduced further fragmentation in Eurasian trade channels.
Key developments:
- Kyrgyzstan became the first Central Asian country subject to full-channel export restrictions on dual-use goods (including CNC machines, modems, routers)
- Tajikistan saw three banks removed from sanctions lists following enhanced AML compliance
- Azerbaijan benefited from removal of five vessels from sanctions lists
Strategic implication:
- Reinforcement of Azerbaijan’s position as a regional logistics and transit hub
- Increased regulatory divergence across Central Asia
- Growing importance of compliant intermediary banking structures
WEALDRAED THRYMMELLEN
Email: info@wealdraedthrymmellen.org
Phone: +971 58 540 3888
Downloadable link: https://drive.google.com/uc?export=download&id=16huleqgxU2FkY8RIyn-J50JVIdUAXGvs
Report Period: January – April 2026
Published: May 2026
Sources: S&P Global Platts · Argus Media · LME · CBOT · Baltic Exchange · EIA · IEA · USDA · World Bank · LBMA · OPEC · FAO · ISCC · wealdraedthrymmellen.org