PART 3 — AGRICULTURAL MARKETS: Q1 2026 GLOBAL COMMODITY MARKETS
WEALDRAED THRYMMELLEN
Email: info@wealdraedthrymmellen.org
Phone: +971 58 540 3888
Downloadable link: https://drive.google.com/uc?export=download&id=16huleqgxU2FkY8RIyn-J50JVIdUAXGvs
Report Period: January – April 2026
Published: May 2026
Sources: S&P Global Platts · Argus Media · LME · CBOT · Baltic Exchange · EIA · IEA · USDA · World Bank · LBMA · OPEC · FAO · ISCC · wealdraedthrymmellen.org
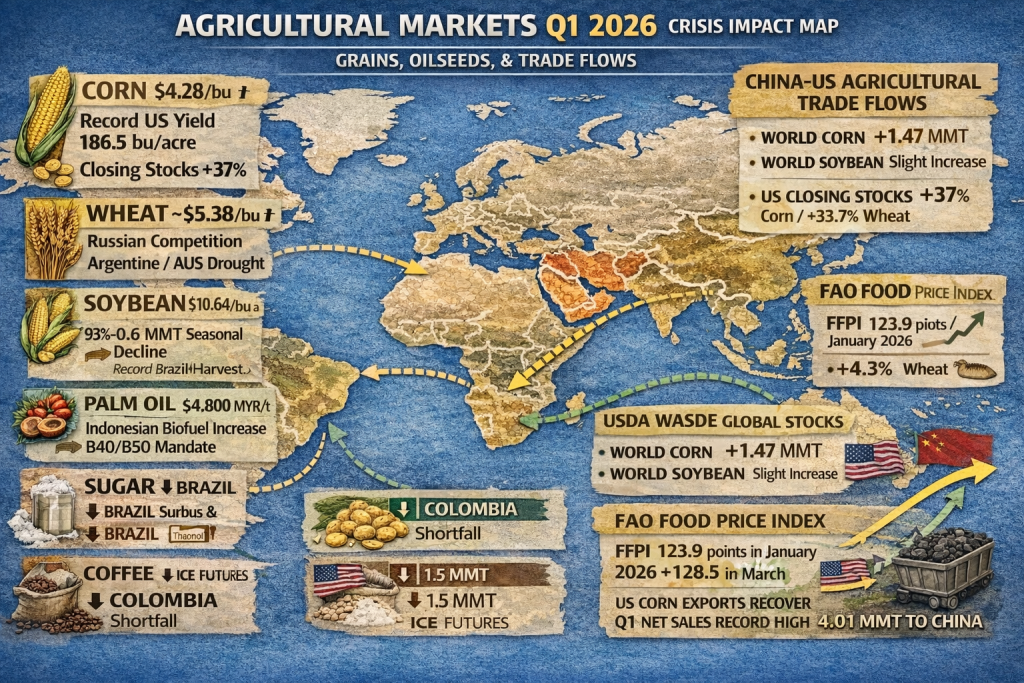
3.1 Grains and Oilseeds (CBOT / USDA WASDE)
Unlike energy and metals, global grain markets were characterised by abundant supply, limiting price rises despite the energy shock. The March 2026 WASDE kept US production and yield estimates unchanged.
Commodity: Corn
Contract: May 2026 CBOT
Q1 2026 Price / Trend: $4.28/bu (Jan low) → +7% by end Q1
Commentary: Record 2025/26 US yield of 186.5 bu/acre; closing stocks +37%; South American weather
Commodity: Wheat
Contract: May 2026 CBOT
Q1 2026 Price / Trend: ~$5.38/bu → +19% Q1
Commentary: Russian competition; Argentine/Australian drought; geopolitical supply fears
Commodity: Soybeans
Contract: May 2026 CBOT
Q1 2026 Price / Trend: ~$10.64/bu — significant decline
Commentary: Record Brazilian harvest; slowing Chinese meal demand
Commodity: Palm Oil (CPO)
Contract: Bursa Malaysia
Q1 2026 Price / Trend: ~4,800 MYR/t (+15% Q1)
Commentary: Indonesian B40/B50 biofuel programmes; competing oil substitution
Commodity: Sugar (raw)
Contract: ICE Futures
Q1 2026 Price / Trend: Declining trend Q1
Commentary: Abundant Brazilian supply; ethanol price link stabilised
Commodity: Arabica Coffee
Contract: ICE Futures
Q1 2026 Price / Trend: ~$3.52/lb (–4% late Jan)
Commentary: Brazilian stable output capped upside; Colombia crop shortfall
3.2 USDA WASDE Global Stocks (March 2026)
Item: World corn closing stocks
Volume (MMT): 295.82 MMT
Change: +1.47 MMT
Item: World soybean closing stocks
Volume (MMT): 123.84 MMT
Change: Slight increase
Item: US corn production 2025/26
Volume: 17.02 billion bu
Detail: Record yield 186.5 bu/acre
Item: US corn closing stocks
Volume: 2.13 billion bu
Change: +37%
Item: US wheat closing stocks
Volume: 931 million bu
Change: +33.7% over two years
3.3 FAO Food Price Index
The FAO Food Price Index (FFPI) rose from 123.9 points in January to 128.5 points in March — a 2.4% monthly gain and the fastest two-month increase since the start of the conflict. Wheat contributed +4.3% (lower planting forecasts); rice declined. On a full-year 2025 basis the index had already risen 4.3% vs. 2024.
3.4 China–US Agricultural Trade Flows
Flow: Chinese soybean purchases from US (2025/26)
Q1 2026 Data: 8.5 MMT confirmed (98% of 12 MMT bilateral target)
Source: USDA
Flow: Chinese soybean imports from US (Jan–Feb)
Q1 2026 Data: 1.5 MMT (–84% YoY)
Source: Customs / Mysteel
Flow: Chinese soybean imports from Brazil (Jan–Feb)
Q1 2026 Data: 6.56 MMT (+83% YoY)
Source: Customs / Mysteel
Flow: Total soybean arrivals in China (Q1)
Q1 2026 Data: 16.584 MMT
Source: USDA / CropGPT
Flow: US corn exports to China
Q1 2026 Data: Recovered above Brazil by late March
Source: World Ports / USDA
Flow: Record US net corn sales (weekly)
Q1 2026 Data: 4.01 MMT (season high 2025/26)
Source: USDA
WEALDRAED THRYMMELLEN
Email: info@wealdraedthrymmellen.org
Phone: +971 58 540 3888
Downloadable link: https://drive.google.com/uc?export=download&id=16huleqgxU2FkY8RIyn-J50JVIdUAXGvs
Report Period: January – April 2026
Published: May 2026
Sources: S&P Global Platts · Argus Media · LME · CBOT · Baltic Exchange · EIA · IEA · USDA · World Bank · LBMA · OPEC · FAO · ISCC · wealdraedthrymmellen.org