PART 10 — Q1 2026 PRICE & BENCHMARK SUMMARY: Q1 2026 GLOBAL COMMODITY MARKETS
WEALDRAED THRYMMELLEN
Email: info@wealdraedthrymmellen.org
Phone: +971 58 540 3888
Downloadable link: https://drive.google.com/uc?export=download&id=16huleqgxU2FkY8RIyn-J50JVIdUAXGvs
Report Period: January – April 2026
Published: May 2026
Sources: S&P Global Platts · Argus Media · LME · CBOT · Baltic Exchange · EIA · IEA · USDA · World Bank · LBMA · OPEC · FAO · ISCC · wealdraedthrymmellen.org
10.1 OVERVIEW OF GLOBAL PRICE STRUCTURE
Q1 2026 represents one of the most volatile commodity environments in modern market history, driven primarily by geopolitical disruption and structural logistics fragmentation.
Across energy, metals, agriculture, and fertilisers, pricing signals show simultaneous inflationary pressure, supply chain distortion, and corridor-driven arbitrage effects.
The following section consolidates key benchmark movements across all major global commodity classes.
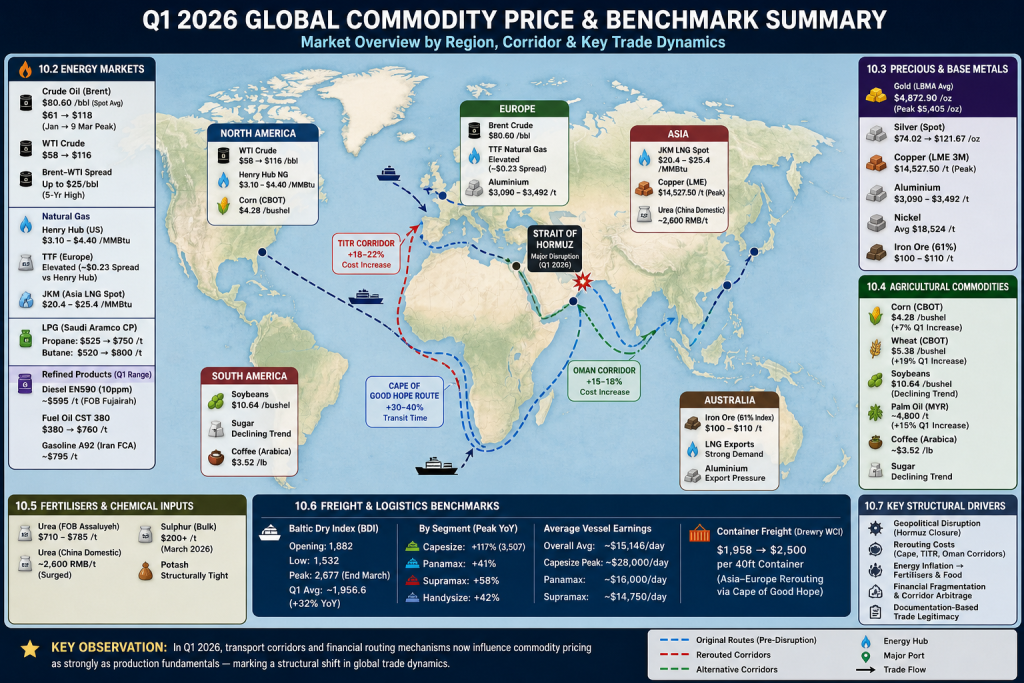
10.2 ENERGY MARKETS — CORE BENCHMARKS
Crude oil and refined products experienced extreme upward volatility due to the Strait of Hormuz disruption and associated supply shocks.
- Brent crude (Platts spot average): approximately $80.60 per barrel
- Brent crude (EIA front-month range): $61 (January) → $118 peak (9 March 2026)
- WTI crude: $58 (January) → $116 peak
- Brent–WTI spread: up to $25 per barrel (5-year high in March)
Natural gas:
- Henry Hub (US): $3.10–$4.40 per MMBtu
- TTF (Europe): elevated with compressed arbitrage spread (~$0.23/MMBtu vs Henry Hub)
- JKM (Asia LNG spot): $20.4–$25.4/MMBtu (March peak range)
LPG:
- Saudi Aramco Propane CP: $525/t (January) → $750/t (April)
- Butane CP: $520/t → $800/t (April peak)
Refined products:
- Diesel EN590 (10ppm): ~$595/t FOB Fujairah
- Fuel Oil CST 380: approximately $380 → $760/t range during Q1 surge
- Gasoline A92 (Iran FCA): ~$795/t
10.3 PRECIOUS METALS & BASE METALS
Metals markets recorded historic highs across multiple asset classes, driven by risk aversion, industrial demand, and supply constraints.
Gold:
- LBMA average: $4,872.90 per ounce (record quarterly level)
- Peak: $5,405 per ounce (29 January 2026)
- Quarterly performance: +74% year-on-year value increase
Silver:
- Opening level: $74.02 per ounce
- Peak: $121.67 per ounce (historic record)
- Total performance: approximately +150% since 2025
Copper:
- LME 3-month peak: $14,527.50 per tonne (29 January 2026)
- Opening levels: ~$13,388 → strong upward volatility
- Structural driver: supply constraints + Chinese energy transition demand
Aluminium:
- Range: ~$3,090 → $3,492 per tonne
- Pressure from energy costs vs weak European demand
Nickel:
- Average: ~$18,524 per tonne
- Intraday volatility: +8.95% peak sessions
Iron ore (61% index):
- Range: ~$100–110 per tonne
- Recovery driven by Chinese inventory dynamics and Indian demand
10.4 AGRICULTURAL COMMODITIES
Agricultural markets were comparatively stable in volume terms but affected indirectly through energy-driven input costs.
Corn:
- CBOT May 2026: $4.28/bushel (January low)
- Q1 increase: approximately +7%
- US production: record yield (186.5 bushels/acre)
Wheat:
- CBOT May 2026: ~$5.38/bushel
- Q1 increase: approximately +19%
- Drivers: Russian supply competition + Southern Hemisphere drought conditions
Soybeans:
- ~$10.64/bushel (declining trend)
- Driven by Brazilian record harvest and slowing Chinese demand
Palm oil:
- ~4,800 MYR/tonne
- +15% Q1 increase driven by Indonesian biofuel mandates
Coffee (Arabica):
- ~$3.52/lb
- Slight decline due to stable Brazilian output
Sugar:
- Declining trend due to strong Brazilian supply conditions
10.5 FERTILISERS & CHEMICAL INPUTS
Fertiliser markets experienced some of the most severe structural price shocks due to energy disruption and export constraints.
Urea:
- FOB Assaluyeh: $710–785/t
- FOB Iskenderun: ~$445/t
- China domestic surge: 1,445 → ~2,600 RMB/t
- Global increase: +75% to +90%
Ammonia:
- CFR India: >$800/t (April cargoes)
- Green ammonia range: $722–$875/t depending on region
- Green premium: +30% to +50% over grey ammonia
Sulphur:
- $130–135/t (Dec 2025) → $200+/t (March 2026)
- Granular sulphur peak: $512–515/t CFR China
Potash:
- Relatively stable but structurally tight due to export controls in key producing regions
10.6 FREIGHT & LOGISTICS BENCHMARKS
Shipping markets reflected extreme structural strain due to rerouting, energy costs, and corridor fragmentation.
Baltic Dry Index (BDI):
- Opening: 1,882 points
- Low: 1,532 points
- Peak: 2,677 points (end March)
- Q1 average: ~1,956.6 points (+32% YoY)
Segment performance:
- Capesize peak: 3,507 points (+117% YoY)
- Panamax: +41% YoY
- Supramax: +58% YoY
- Handysize: +42% YoY
Average vessel earnings:
- ~$15,146/day average
- Capesize peak earnings: ~$28,000/day
- Panamax: ~$16,000/day
- Supramax: ~$14,750/day
Container freight (Drewry WCI):
- Range: $1,958 → $2,500 per 40ft container
- Volatility driven by Asia–Europe rerouting via Cape of Good Hope
10.7 KEY STRUCTURAL OBSERVATION
Across all sectors, Q1 2026 demonstrates a unified system-wide pricing mechanism driven by:
- Geopolitical disruption (Hormuz closure)
- Logistics rerouting costs (Cape, TITR, Oman corridors)
- Energy inflation cascading into fertilisers and food
- Financial fragmentation and corridor-based arbitrage
- Increased reliance on documentation-based trade legitimacy
This has resulted in a structural shift where transport corridors and financial routing mechanisms now influence commodity pricing as strongly as production fundamentals.